NHS Resource Utilisation & Missed Appointments
Data-driven insights into demand, missed appointments, and public sentiment.
This project was completed as part of the LSE DA201: Diagnostic Analytics with Python course.
Final Score: 89%
Executive Summary
Why this matters
- GP demand now averages 25.8M appointments/month – 15% above pre-COVID levels
- Clinics operate at 115% of planned capacity – no slack for shocks
- 4.7% of capacity is lost to missed appointments (DNA), mainly from short-notice and remote bookings
Board-level actions:
- Target DNA hotspots – SMS reminders for bookings ≤ 7 days
- Rebalance staffing – Shift resources to high-demand ICBs and manage seasonal peaks
- Monitor sentiment – Track hashtags like #NHSCrisis and #ThankYouNHS weekly
Tools & Techniques
Languages & Libraries: Python, Pandas, NumPy, Matplotlib, Seaborn, Scikit-learn, Statsmodels, Plotly, Dash, Geopandas, TextBlob
Techniques Applied:
- Descriptive statistics and exploratory data analysis (EDA)
- Seasonal demand analysis using grouped bar charts by period
- Logistic regression to model missed appointments (DNA)
- ROC curve and AUC evaluation (AUC = 0.569)
- Twitter sentiment analysis using TextBlob polarity scores
- Keyword and hashtag filtering using regular expressions (regex)
- Utilisation mapping and regional comparisons by ICB
- Date parsing and classification into seasonal categories using
datetime - Interactive dashboard design using Plotly and JupyterDash (prototype stage)
Dashboard Highlights
KPIs Overview
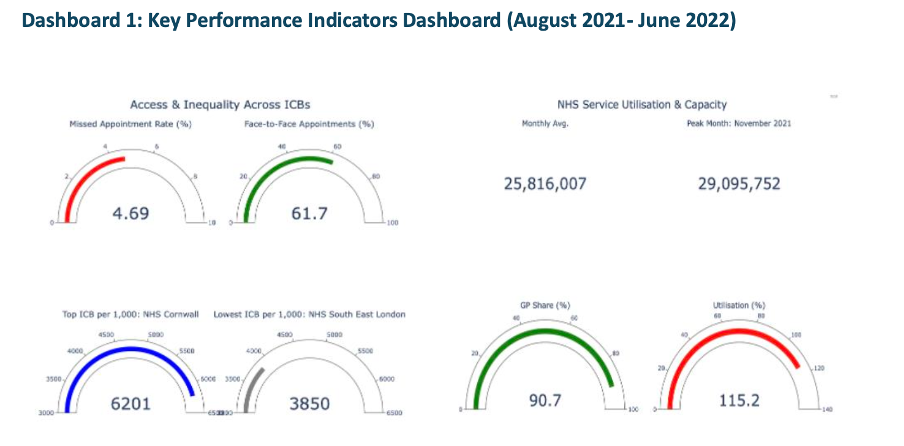
This dashboard summarises key NHS performance indicators from August 2021 to June 2022. Clinics handled an average of 25.8 million appointments/month, with a peak of 29.1 million in November. Face-to-face care still made up 61.7% of visits, while 90.7% of all appointments were delivered by GPs. The missed appointment (DNA) rate was 4.69%. Significant regional inequality is visible: Cornwall led with 6,201 appointments per 1,000 people, while South East London trailed at just 3,850.
Capacity Utilisation vs Planning Limit
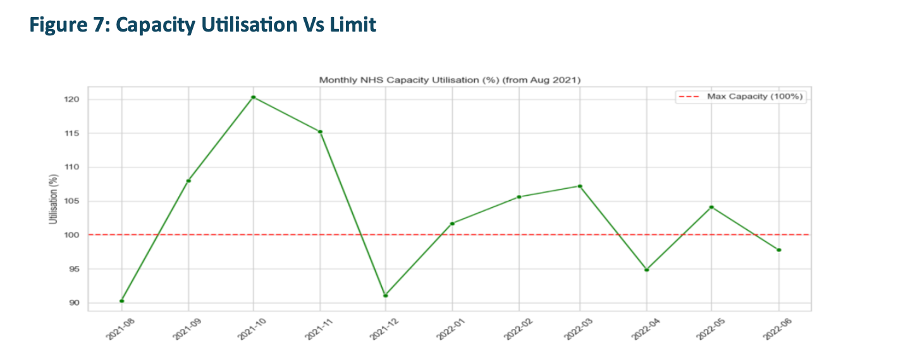
NHS services consistently operated over capacity. Monthly utilisation breached 100% regularly, reaching a critical 120% in October 2021. Even quieter months stayed close to full, confirming structural overuse rather than temporary surges. This supports the case for flexible staffing and strategic surge planning.
Detailed Capacity Utilisation
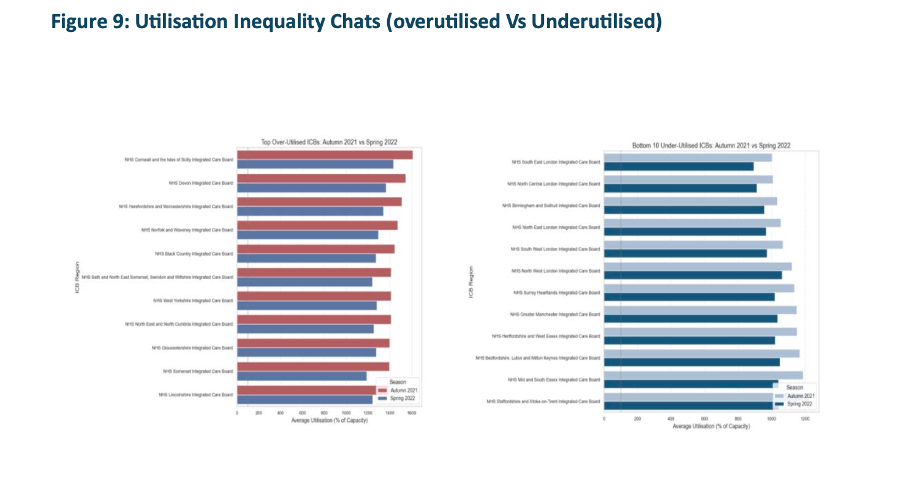
This chart offers a more granular view of how NHS appointment volumes exceeded planned capacity across regions and time. Persistent over-utilisation beyond 100% confirms that system pressure is not isolated to seasonal peaks but reflects an ongoing resource gap. This visual supports arguments for structural staffing reforms and flexible surge management.
Missed Appointments Trends
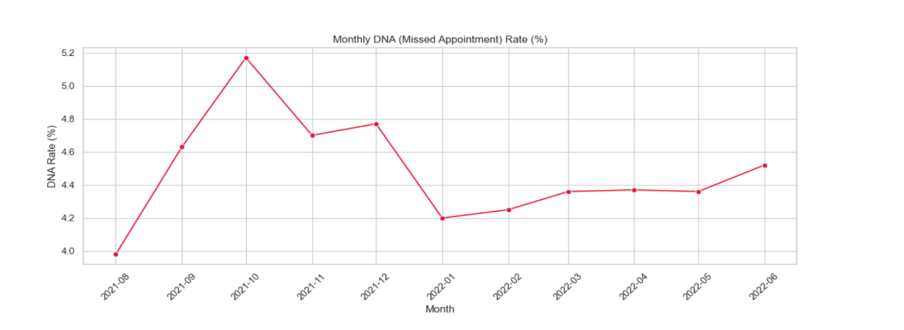
Monthly missed appointments (DNAs) ranged between 4.2% and 5.18%, with an October 2021 spike of over 1.5 million no-shows. Logistic regression confirmed that short-notice bookings (especially same-day) and remote formats like telephone/video were the strongest predictors of DNA risk.
Appointment Volume by Season
Seasonal variation plays a significant role in NHS service pressure. The bar charts below compare total and average monthly appointments by season across the dataset timeframe (Aug 2021–Jun 2022).
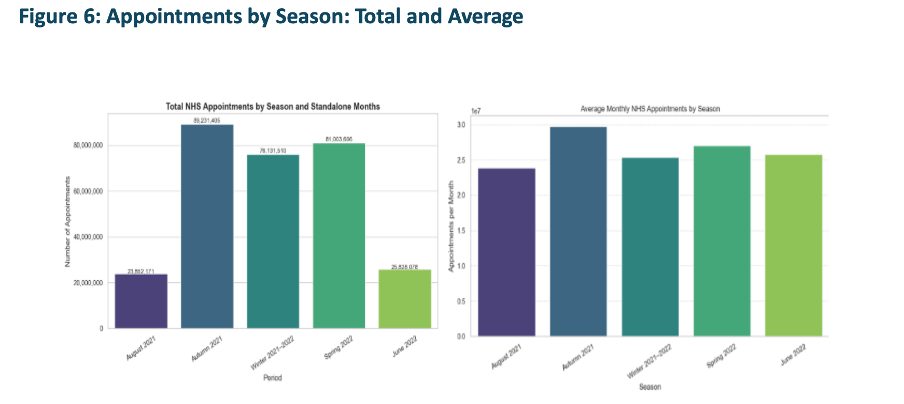
Autumn and Winter had the highest appointment volumes, with Autumn peaking at nearly 90 million. This aligns with post-lockdown recovery and seasonal illness trends. June and August, as standalone months, saw noticeably lower volume, consistent with holiday effects.
Predicting Missed Appointments
To better understand what increases the likelihood of missed appointments (DNA), I trained a logistic regression model using post-lockdown appointment data. The chart below shows the odds ratios for various predictors.
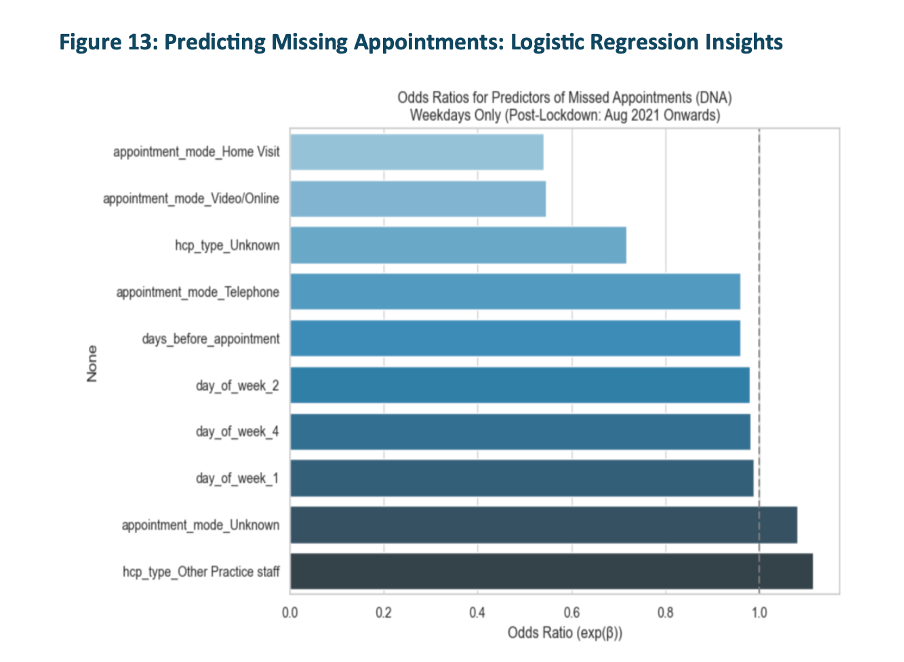
This analysis revealed that telephone and video/online appointments had a significantly higher likelihood of being missed, compared to face-to-face. Weekday and lead time (days_before_appointment) also influenced DNA risk. The model's AUC score was 0.569, suggesting moderate predictive power. These insights can support targeted interventions like reminders for short-notice or remote bookings.
In addition to internal NHS data, Twitter posts mentioning NHS-related keywords were analysed using sentiment scoring and hashtag frequency. This helped contextualize public discourse around healthcare access and perception.
Public Sentiment – Twitter Hashtags
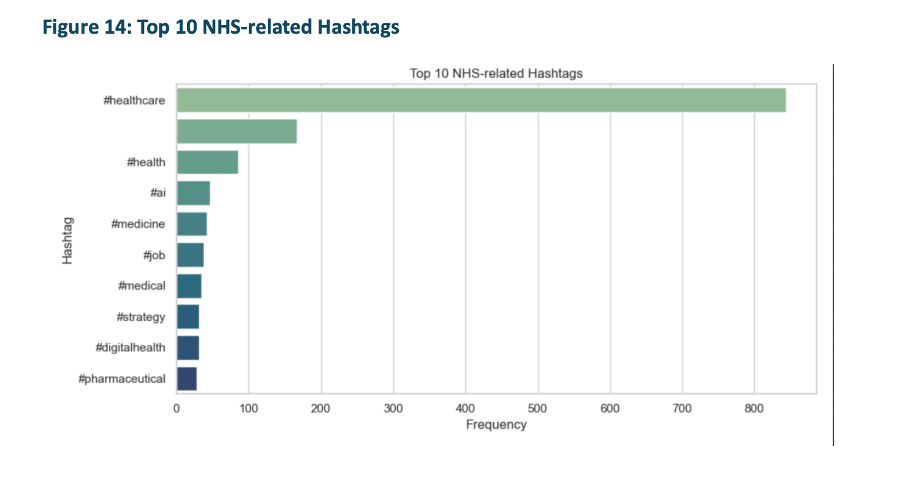
Twitter sentiment focused heavily on general healthcare (#healthcare), digital transformation (#digitalhealth, #AI), and workforce challenges (#job, #staffing). These trends aligned with NHS performance dips and policy moments, validating social media as a real-time feedback loop for public trust and system strain.
💡 How to use this notebook:
This live preview displays the full Jupyter Notebook used in the analysis. It includes:
- All data cleaning and preparation steps using Python (Pandas)
- Visualisation of trends using Matplotlib and Seaborn
- A logistic regression model to predict missed appointments (DNA)
- Twitter sentiment analysis using VADER
You can scroll through the notebook below to see all code cells, visual outputs, and commentary.
Live HTML Notebook Preview
Download Full Report (PDF) 🌐 Open Notebook in New Tab Download Jupyter Notebook (.ipynb)