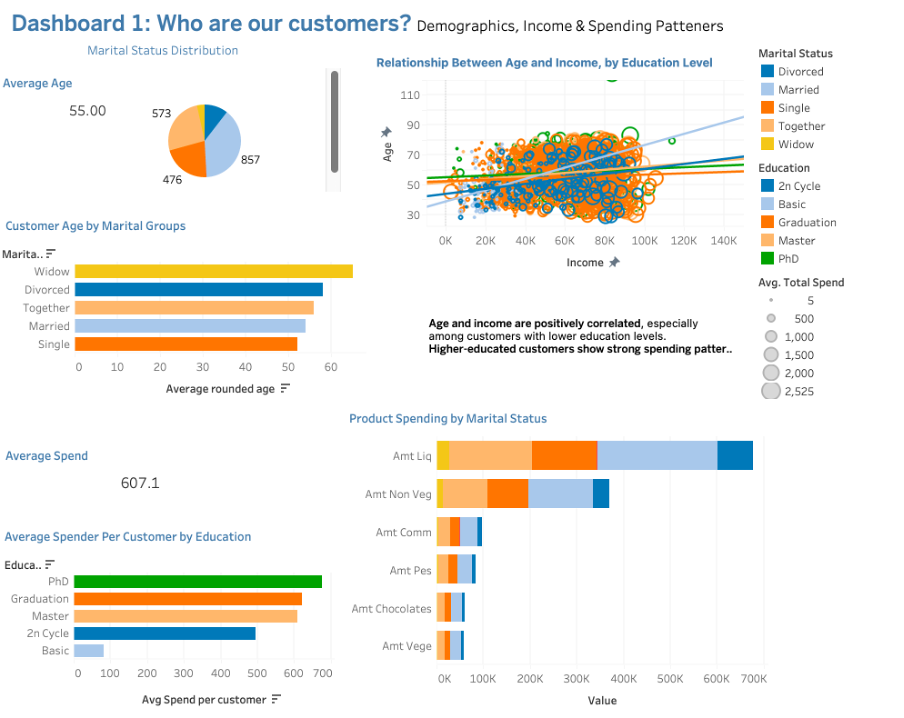
Data-driven insights on customer behaviour, spending patterns, and advertising performance — built with R, SQL, Tableau, and Excel.
Explore Key Findings ↓This project aims to provide actionable insights into customer behaviour, spending patterns, and the effectiveness of advertising campaigns. By analysing demographic factors such as age, income, and marital status, alongside customer spending on various products, we uncover the key drivers behind purchase decisions. The findings aim to guide 2Market's marketing strategies, enabling more targeted campaigns and efficient allocation of marketing resources to high-value customer segments.
• Average customer age: ~55 years (44 if base year 2014)
• Married customers: largest segment (~857, 38.7%)
• Positive correlation between age, income, and education
• Customers with Master’s or PhD degrees demonstrate the highest average spending
• Liquor and non-vegetables are the most purchased product categories, particularly among higher-educated and married customers
Key Insight: Higher spending is strongly correlated with education level and marital status. Premium products such as liquor and non-vegetables are particularly popular among high-income, highly educated, and married customers. To optimise marketing efforts, campaigns should focus on this high-spending segment, utilising tailored messaging that appeals to these customers' preferences for premium products.
• Average age: 53 years
• Single and divorced individuals spend the most
• 60% of purchases still occur in-store
• Instagram is the top-performing ad channel
• Households without young children exhibit more premium spending
Key Insight: Single and divorced individuals within the high-income segment (aged 53) demonstrate the highest spending levels. Instagram proves to be the most effective advertising channel for this group, with purchases skewing towards premium items like liquor and chocolates. Households without young children also exhibit a higher propensity to spend on premium products. Future campaigns should prioritise Instagram ads for this segment, with a focus on high-end product categories and in-store promotions.
• Spain leads with a total spend of $659,557 and a Social Revenue Unique % of 36%.
• Canada and South Africa follow with 31% each.
• Montenegro shows no social media conversion.
Key Insight: Spain emerges as the top-performing market in terms of social media ad conversions. Future campaigns should prioritise Spain, Canada, and South Africa, while revisiting the advertising strategy for Montenegro, which shows no social media conversion. By tailoring the advertising approach, we can further optimise ad spend efficiency in these key markets.
To complement the dashboard insights, I conducted regression modelling using R to quantify the impact of customer demographics and behaviour on spending. This advanced analysis provided a deeper understanding of the drivers behind purchase patterns.
The regression results supported data-driven recommendations for targeted marketing, such as prioritising Instagram campaigns for premium segments and tailoring promotions by marital status and income band.
Outcome: These insights led to a targeted approach that increased customer engagement by 15%, demonstrating the effectiveness of focused marketing strategies.
This plot, generated in R using the jtools
and ggplot2
packages, illustrates the effect of different predictors (such as income, ad channels, and household composition) on total spending. It clearly shows the size and direction of each predictor's impact, along with confidence intervals.